|
On January 25, 2017, the Dow Jones industrial average cleared the 20,000 barrier. But what does that really mean for the markets? A number like 20k catches headlines, and the media and investors have fun with it, but in true economic terms, 20k does not actually mean anything. What does mean something is the current run up of the market and whether the market has become overpriced. One way of examining the market prices is by looking at the Price to Earnings (PE) ratio.
The Historical PE
At Beacon, our portfolios invest in sectors, so we don’t use PE ratios in our calculations, but we definitely do consider them in their historical context. For example, if we look at the equity market today, it is pricey. The S&P 500 PE ratio “since 1900 is approximately 15.8, and the ratio since 1946 (the post-World War II period) is 17.3.” So historically, the normal PE ratio is about 16.5 based on trailing twelve month’s (TTM) earnings.1
How pricey does that make the current PE ratio currently? As of February 17, 2017, The S&P 500 PE Ratio stood at 26.39.2 That number puts the PE ratio nearly 60 percent higher than the historical average or “about double the range of ‘pricey’.”3
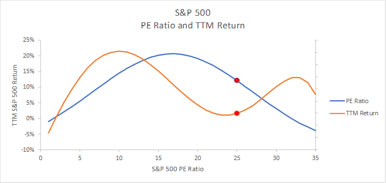
Source: Beacon Capital Management
Let’s look at two very significant times in recent history to get a better perspective of what these values mean today.
The Recent Bubbles
The PE ratio on March 31, 2000, was 28.2. This was at the peak of the dot-com bubble and after the bubble burst you wound up with a minus 22 percent return over the next 12 months. The next bear market took an even bigger hit. On November 30, 2007, the PE Ratio peaked at 23. The market gave us a minus 38 percent return over the next 12 months. But, in both of those cases, we can identify specific bubbles. How do those relate to our current economic climate?
Our Unique Times
If you look at just the PE Ratios, you could say, “wow, those are out of line right now. Maybe I should do something.” However, the reason this time appears to be a little different is the big surprise we had with the election. Basically, the entire market had priced in a Clinton victory. There was panic, then the market decided to ramp up to a Trump presidency, initially. (For more on the emotional impact of the election on the markets, click here to read my recent Investopedia article!)
Now, the markets have gotten a second wind. The policies the Trump administration have in play are attractive to the business community. The tax reforms and financial regulations that are on the table would, in theory, allow companies to move faster, bring out new products more quickly, and generate more revenue.
So, the markets today are looking ahead. They realize the earnings are low, but they’re hedging that the Trump philosophies will bring earnings up, bringing the PE Ratio more in line with its historical average.
Stop-Loss
Today’s marketplace is more unpredictable than ever. Things could keep going up with the changes the Trump administration has in place. But what if they don’t? What if even one of the regulatory plans falls through? What would that do to the markets? Losses are more powerful than gains, and at today’s prices, that leaves a long way to fall. At Beacon, we believe our mechanical stop-loss approach is more important than ever to help eliminate these questions and uncertainties while still participating in upside potential.
For more tips and insights on how Beacon portfolios work to deliver consistent returns in today’s market, contact your wholesaler today!
1. https://www.marketwatch.com/story/is-the-stock-market-overpriced-2017-01-03
2. https://www.multpl.com/
3. https://www.marketwatch.com/story/is-the-stock-market-overpriced-2017-01-03
|