If the economy is in quicksand, why has the S&P 500 traded at all-time highs in 2020? This may be a question you are hearing if your clients look to the S&P as a benchmark. The answer: they are comparing their performance to an index completely disconnected to the U.S. economy and the everyday realities for the average investor. According to Beacon’s Dan Baccarini, “The S&P doesn’t represent anything meaningful to the average investor. And it’s for two reasons: One is the composition of the S&P, and number two is the disconnect with the S&P and the economy.”
1) The overweight composition of the S&P 500: 1% of the stocks in the S&P 500 represents more than 20% of the total allocation.
If you gave your clients five stocks to bet their entire retirement savings on, they would think you were crazy. Did we mention those five stocks are also in the same industry? That’s exactly what’s happening in the S&P 500. While the index tracks the top 500 stocks, as of August 20201, 27% of the S&P is in the technology sector, with only five companies making up 23% of the total index. This is the highest overweight concentration in a handful of companies we have seen in market history. As we saw in the early 2000s and 2008, it is this type of overweight concentration that leads to market bubbles with devastating bursts.
Add to that, over half2 of the tech stocks’ revenue is derived from overseas. For example, 31% of Google’s revenue comes from the EMEA region and 17% from the APAC region. A downturn in any one of these economies will have far-reaching consequences on the tech sector.
2) The disconnect of the S&P 500 with the economy: The S&P 500 continues to trade at all-time highs, despite arguably the worst U.S. economic collapse since the Great Depression.
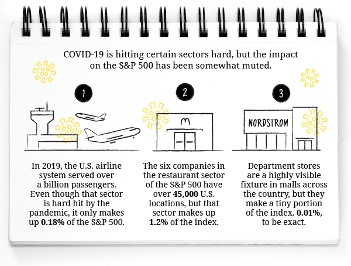
In addition to being overweight in the top five companies within the tech sector, the composition of the S&P 500 doesn’t reflect the entire economy. Of the 500 companies, about 450 of them are doing terribly in 2020! Entire critical sectors that affect everyday life are being largely ignored. For example, the consumer discretionary sector, which is made up of luxury goods, apparel, travel, restaurants, vehicles, lodging, and department stores, represents 64 companies (excluding Amazon,) but only makes up 6% of the total index value as of the end of July3. Department stores are down 62.6%, airlines off 55%, oil and gas equipment is down 50.5%. United Airlines4 cut its workforce by 25% with revenue down 87% from last year. This represents a real struggle for America, but it doesn’t put a dent in the performance of the S&P 500 because airlines contribute only 0.18% to the index!
With the S&P 500 holding more than its share of attention in the headlines, it’s important to educate your clients on all of these pitfalls and considerations. For those investors who might think that these mega-tech stocks are “safe” due to their massive scale, remind them of how these bubbles can change in an instant, and that only one of the companies that was in the top five in 2000 still is on top today—Microsoft.
For additional ideas or recommendations on timely client conversations, feel free to contact your wholesaler or visit our Advisor Toolbox for a number of great resources explaining our equal sector allocation philosophy.